Permissible speed method
When calculating the air duct network using the permissible speed method, the optimal air speed is taken as the initial data (see table). Then the required cross-section of the air duct and the pressure loss in it are calculated.
Procedure for aerodynamic calculation of air ducts using the permissible speed method:
- Draw a diagram of the air distribution system. For each section of the air duct, indicate the length and amount of air passing in 1 hour.
- We start the calculation from the areas farthest from the fan and the most loaded.
- Knowing the optimal air speed for a given room and the volume of air passing through the air duct in 1 hour, we will determine the appropriate diameter (or cross-section) of the air duct.
- We calculate the pressure loss due to friction P tr.
- Using the tabular data, we determine the sum of local resistances Q and calculate the pressure loss due to local resistances z.
- The available pressure for the following branches of the air distribution network is determined as the sum of pressure losses in the areas located before this branch.
During the calculation process, it is necessary to sequentially link all branches of the network, equating the resistance of each branch to the resistance of the most loaded branch. This is done using diaphragms. They are installed on lightly loaded areas of air ducts, increasing resistance.
Source
Static Pressure - Fan
Fan static pressure, which is the total pressure of the fan minus the velocity head.
The static pressure of the fan is defined as the difference between the total pressure Yap and the dynamic pressure Yand in the discharge pipe of the fan.
The role of fan static pressure is quite significant, and with the currently accepted method of selecting a fan based on total pressure, this should not be forgotten. This is especially important when calculating a ventilation network consisting only of a suction branch: calculating the resistance of the suction branch and selecting a fan based on this value, forgetting about the dynamic pressure at the outlet of the fan, which, by the way, can be very significant, is unacceptable.
Thus, the static pressure of a fan operating in the ventilation network is spent to overcome the total pressure losses in the network minus the difference between the dynamic pressure at the air outlet from the fan and the dynamic pressure at the air outlet from the network.
Thus, the static pressure of a fan operating in a ventilation network is spent on overcoming the resistance of the network minus the difference between the dynamic pressure at the air outlet from the fan and the dynamic pressure at the air outlet from the network.
As a first approximation, the static pressure of the fan is set.
Let's consider how the static pressure of a fan operating in a network is consumed in the absence of suction and discharge volumes in it.
Since in this case pdv is out, psv is hBC, i.e. The static pressure of the fan is equal to the network resistance.
Operating (conditionally) performance coefficient Qp, determined by the abscissa of the intersection point of the static pressure characteristic of the fan and the aerodynamic resistance curve of the electric machine.
| Classification of fans by drive type. |
If the fan is selected correctly, then the system resistance changes in proportion to the square of the air flow (see Fig. 20 - 5), and the static pressure of the fan is approximately inversely proportional to the change in air flow, which significantly inhibits the tendency to both increase air flow and increase the load of the electric motor. This, in turn, indicates that it is inappropriate to install an electric motor with a large margin. Additionally, electric motors typically operate more efficiently when fully loaded. Since power consumption varies proportionally to the cube of the speed, the electric motor requires a small starting torque.
In the presence of an injection network, dynamic pressure is always taken into account, and therefore the role of static pressure simply does not appear explicitly. If the ventilation system is installed without complying with its design, the value of the static pressure of the fan will immediately become apparent.
| To determine the operating mode of a fan installed in the network. |
At this point the total pressure of the fan is equal to the total pressure loss in the network. If the fan operates on suction, then the dynamic pressure of the fan should also be related to the pressure loss in the network or the fan operating mode should be determined by the intersection of the network characteristic Dp ( 2) with the characteristic psti ( Q) of the static pressure of the fan. In such cases, it is advisable to install a diffuser at the outlet of the fan to reduce the dynamic pressure of the fan.
This diagram allows you to determine the size and rotation speed of the fan of the selected type without making any additional calculations. To do this, using the given values of performance Q and total pressure PC, a point corresponding to the fan operating mode is marked on the diagram. The curve p0 (Y) closest to this point is determined, using the anchor point of which the diameter and rotation speed of the fan are determined. The diagram cannot be used if not the total, but the static pressure of the fan is specified and if the operating mode of the fan is outside the operating range of the characteristic.
Calculation of pressure loss in air ducts in a ventilation system
Ventilation services › Ventilation design ›
When the parameters of the air ducts are known (their length, cross-section, coefficient of air friction on the surface), it is possible to calculate the pressure loss in the system at the designed air flow.
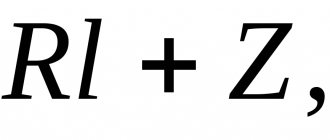
Total pressure loss (in kg/sq.m.) is calculated using the formula:
where R is the pressure loss due to friction per 1 linear meter of the air duct, l is the length of the air duct in meters, z is the pressure loss due to local resistance (with a variable cross-section).
1. Friction losses:
In a round air duct, pressure loss due to friction P tr is calculated as follows:
where x is the friction resistance coefficient, l is the length of the air duct in meters, d is the diameter of the air duct in meters, v is the air flow speed in m/s, y is the air density in kg/cub.m., g is the acceleration of free fall (9 .8 m/s2).
- Note: If the duct has a rectangular rather than a round cross-section, the equivalent diameter must be substituted into the formula, which for an air duct with sides A and B is equal to: deq = 2AB/(A + B)
2. Losses due to local resistance:
Pressure losses due to local resistance are calculated using the formula:
where Q is the sum of the local resistance coefficients in the section of the air duct for which the calculation is being made, v is the air flow speed in m/s, y is the air density in kg/cub.m., g is the acceleration of free fall (9.8 m/s2 ). Q values are presented in tabular form.
Round and rectangular ducts
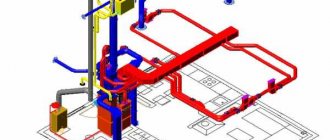
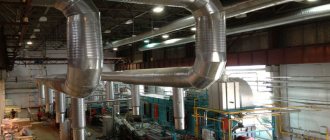
Air ducts used in ventilation and air conditioning systems can be of round or rectangular cross-section (see Figure 1).
Round air ducts are spiral-wound air ducts, the material for which is usually galvanized steel strip. They are considered more preferable both from an aerodynamic and financial point of view, since they have less resistance per unit length with the same cross-sectional area, are easier to manufacture, and therefore cheaper to purchase.
Therefore, when designing ventilation and air conditioning systems, preference should be given to round air ducts. For more information about the cross-sections of round air ducts, read a separate article.
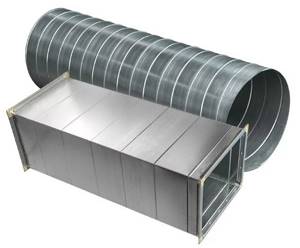
Figure 1. Round (top) and rectangular (bottom) ducts for ventilation and air conditioning systems.
But if everything were so clear, rectangular air ducts would disappear from the market. They help out in two main cases: if it is necessary to reduce one of the dimensions of the air duct - width or, more often, height, and at high air flow rates. However, in the second case, it also comes down to underestimating one of the dimensions, because instead of an air duct with a diameter of 1 meter, it seems much more reasonable to use an air duct with a cross-section of 1200×800 or 1500×700 mm - they allow you to gain, respectively, 200 and 300 millimeters of height in the room.
By the way, central air ducts are rectangular air ducts with a large cross-section. The term is not official and often refers to main air ducts in ventilation systems. They are laid along corridors and are designed to transport large air flows. It is to the central air ducts that the outlets for supplying and extracting air from the premises are connected.
When choosing the cross-section of rectangular air ducts, you should remember the 3:1 recommendation. It lies in the fact that the larger side of the air duct cross-section should not exceed the smaller side by more than three times. Violation of this recommendation leads to poor aerodynamics of the air duct and increased losses.
In addition, when choosing an analogue of a round air duct among rectangular ones, one should be guided not by the equality of areas, but by the equality of equivalent diameters. Thus, the equivalent diameter of a round duct is equal to the diameter of this duct:
DEQ.KR. = DKR.
At the same time, the equivalent diameter of a rectangular duct is calculated by the formula:
DEQ.PR. = 2·A·B/(A+B), where A and B are the width and height of the rectangular duct.
When choosing a section of a rectangular duct, you should select A and B such that the equivalent diameter of this duct is equal to the diameter of the round duct from which the transition to this rectangular duct is made.
Stage one
This includes an aerodynamic calculation of mechanical air conditioning or ventilation systems, which includes a number of sequential operations. A diagram is drawn up in axonometry, which includes ventilation: both supply and exhaust, and is prepared for calculation.
The dimensions of the cross-sectional area of the air ducts are determined depending on their type: round or rectangular.
Formation of the scheme
The diagram is drawn up in axonometry with a scale of 1:100. It indicates points with located ventilation devices and the consumption of air passing through them.
When building a highway, you should pay attention to what kind of system is being designed: supply or exhaust
Supply
Here the calculation line is lined up from the most distant air distributor with the highest consumption. It passes through supply elements such as air ducts and the ventilation unit right up to the place where the air is taken in. If the system must serve several floors, then the air distributor is located on the last one.
Exhaust
A line is built from the most remote exhaust device, which consumes the maximum air flow, through the main line to the exhaust hood installation and further to the shaft through which the air is exhausted.
If ventilation is planned for several levels and the hood installation is located on the roof or attic, then the calculation line should start from the air distribution device of the lowest floor or basement, which is also part of the system. If the hood installation is located in the basement, then from the air distribution device of the top floor.
The entire calculation line is divided into segments, each of them represents a section of the air duct with the following characteristics:
- air duct of uniform cross-sectional size;
- from one material;
- with constant air consumption.
The next step is to number the segments. It starts with the most distant exhaust device or air distributor, each being assigned a separate number. The main direction - the highway is highlighted with a thick line.
Next, based on the axonometric diagram, its length is determined for each segment, taking into account the scale and air consumption. The latter is the sum of all quantities of consumed air flow flowing through the branches that are adjacent to the main line. The value of the indicator, which is obtained as a result of sequential summation, should gradually increase.
Determination of dimensional values of air duct sections
Produced based on indicators such as:
- air consumption on the segment;
- The standard recommended values for air flow speed are: on highways - 6m/s, in mines where air is taken - 5m/s.
The preliminary dimensional value of the air duct along the segment is calculated and reduced to the nearest standard. If a rectangular duct is selected, then the values are selected based on the dimensions of the sides, the ratio between which is no more than 1 to 3.
Initial data for calculations
When the diagram of the ventilation system is known, the dimensions of all air ducts have been selected and additional equipment has been determined, the diagram is depicted in a frontal isometric projection, that is, axonometry. If it is carried out in accordance with current standards, then all the information necessary for the calculation will be visible on the drawings (or sketches).
- Using floor plans, you can determine the lengths of horizontal sections of air ducts. If the heights at which the channels pass are marked on the axonometric diagram, then the length of the horizontal sections will also become known. Otherwise, sections of the building with laid air duct routes will be required. And in extreme cases, when there is not enough information, these lengths will have to be determined using measurements at the installation site.
- The diagram should show, using symbols, all additional equipment installed in the channels. These can be diaphragms, electrically driven dampers, fire dampers, as well as devices for air distribution or exhaust (grills, panels, umbrellas, diffusers). Each piece of this equipment creates resistance to the air flow, which must be taken into account when calculating.
- In accordance with the standards, air flow rates and channel sizes must be indicated on the diagram next to the conventional images of air ducts. These are the defining parameters for the calculations.
- All shaped and branching elements must also be reflected in the diagram.
If such a diagram does not exist on paper or in electronic form, then you will have to draw it, at least in a draft version; you cannot do without it when doing calculations.
Calculation software
All calculations can be performed manually, but it is more convenient and faster to use specialized programs.
Using such programs, you can not only accurately perform the necessary calculations, but also prepare drawings.

If necessary, you can use special software to perform calculations. This will eliminate possible errors that could play a fatal role during operation. Primary values are entered into the program and within a few seconds you can obtain accurate calculation results
Vent-Calc is a functional application for calculating air ducts. For calculations, air flow and velocity values, as well as temperature, are used.
MagiCAD - performs all types of calculations for utility networks, images are presented in 2D and 3D formats.
GIDRV is a program for calculating all parameters of air ducts. It is possible to select any combination of parameters to achieve the best performance.
Ducter 2.5 is a utility that accurately calculates the diameters of air duct sections. Ideal for selecting their types.
The drawings that are drawn up in these programs allow you to more accurately see the layout of all system components and ensure their most efficient operation.
How to determine the speed in ventilation ducts?
As can be judged from everything said above, as the main highway it is necessary to choose the chain of successive sections of the network that is the longest; in this case, the numbering should begin exclusively from the most remote section. As for the parameters of each section (and these include air flow, section length, its serial number, etc.), they should also be entered into the calculation table. Then, when the application is completed, the shape of the cross-section is selected and its cross-sections and dimensions are determined.
And to calculate the area of the transverse section of the ventilation network, you must use the calculation formula below:
What do these abbreviations stand for? Let's try to figure it out. So, in our formula:
- LP is the specific air flow rate in the selected area;
- VT is the speed at which air masses move through this area (measured in meters per second);
- FP is the cross-sectional area of the channel we need.
Typically, when determining the speed of movement, it is necessary to be guided, first of all, by considerations of economy and noise level of the entire ventilation network.
Note! Based on the indicator obtained in this way (we are talking about the cross section), it is necessary to select an air duct with standard values, and its actual cross-section (denoted by the abbreviation FF) should be as close as possible to the previously calculated one.
Go ahead. Focusing on the actual area, it is necessary to determine at what speed the air masses should move across the selected area. To do this, use the following formula:
Having received the required speed indicator, it is necessary to calculate how much the pressure in the system will decrease due to friction against the walls of the channels (for this you need to use a special table). As for the local resistance for each section, they should be calculated separately and then summed up into a common indicator. Then, by summing up the local resistance and losses due to friction, the total losses in the air conditioning system can be obtained. In the future, this value will be used to calculate the required amount of gas masses in the ventilation channels.
Previously, we talked about what an air-heating unit is, we talked about its advantages and areas of application, in addition to this article, we advise you to read this information, read about it here
Calculation of friction losses
Flow energy losses are calculated proportionally to the so-called “dynamic” pressure, the value pW2/2, where p is the air density at the flow temperature (determined from table (1) and (2)), and W is the speed in a particular section of the air circulation circuit .
The drop in air pressure due to friction is calculated using the Weisbach formula:
=
— length of the circulation circuit section, m, d eq
- equivalent cross-sectional diameter of the section, m,
- friction resistance coefficient.
coefficient is determined by the air flow regime in the considered section of the circulation circuit, or by the value of the Reynolds criterion:
- speed and equivalent channel diameter and kinematic coefficient of air viscosity (determined from tables /1/ and /2/ ,
m/s.
Re
values in the range
10 5 -10 8
(developed turbulent value) is determined by the Nikuradze formula:
can be obtained from /4/ and /5/ In /5/ there is a diagram for finding the value
, facilitating calculations. Calculated values are expressed in pascals (Pa).
Table 3 summarizes the values of the initial data for each channel: speed, length, cross-section, equivalent diameter, Reynolds criterion value, drag coefficient, dynamic pressure and the value of calculated friction losses.
Table of local resistance coefficients
We have analyzed technical literature and other sources and provide you with tables with CMR values for different elements of the system for your use. In our case, these are catalogs from VEZA, Belimo, a reference book by the designer N, N, Pavlov and a reference book by R.V. Shchekin.
Calculation of supply and exhaust air duct systems comes down to determining the dimensions of the cross-section of the channels, their resistance to air movement and pressure matching in parallel connections. Calculation of pressure losses should be carried out using the method of specific pressure losses due to friction.
Ventilation system calculation form
Pa Values of R
are determined either from special tables or from a nomogram (Figure 3.2) compiled for steel round air ducts with diameter d
.
The same nomogram can also be used to calculate air ducts of rectangular cross-section a b
, only in this case the value
d
is understood as the equivalent diameter
d
e = 2
ab
/ (
a
+
b
).
The nomogram also shows the values of the dynamic pressure of the air flow corresponding to the density of standard air ( t
= 20 o C; φ = 50%; barometric pressure 101.3 kPa;
= 1.2 kg/m 3 ).
At density, the dynamic pressure is equal to the scale reading multiplied by the ratio /1.2. Fans are selected according to aerodynamic characteristics that show the graphical interdependence of their total pressure, flow, rotation speed and peripheral speed of the impeller. These specifications are based on standard air.
It is convenient to select fans using nomograms, which are summary characteristics of fans of one series. Figure 3.3 shows a nomogram for selecting centrifugal fans of the Ts4-70 * series, which are widely used in ventilation systems of agricultural industrial buildings and structures. These fans have high aerodynamic properties and are silent in operation.
From the point corresponding to the found feed value L
c, draw a straight line until it intersects with the ray of the fan number (fan no.) and then vertically to the line of the calculated total pressure
fan
The intersection point corresponds to the fan efficiency
and the value of the dimensionless coefficient
A
, by which the fan rotation speed is calculated (min -1).
The horizontal scale of the nomogram shows the speed of air movement in the fan outlet.
The selection of a fan must be carried out in such a way that its efficiency is not lower than 0.85 of the maximum value.
Required power on the electric motor shaft to drive the fan, kW:
Fig. 3.2 Nomogram for calculations of round steel air ducts
Fig.3.3 Nomogram for selecting centrifugal fans of the Ts4-70 series
Duct types
Air ducts are elements of the system responsible for transporting exhaust and fresh air. The composition includes main pipes of variable cross-section, bends and half-bends, as well as various adapters. They differ in material and cross-sectional shape.
The scope of application and the specifics of air movement depend on the type of air duct. There is the following classification by material:
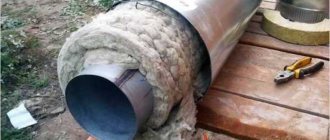
- Steel - rigid air ducts with thick walls.
- Aluminum - flexible, with thin walls.
- Plastic.
- Fabric.
According to the shape of the sections, they are divided into round of different diameters, square and rectangular.
Stage two
Here the aerodynamic drag values are calculated. After selecting standard sections of air ducts, the value of the air flow speed in the system is specified.
Calculation of pressure loss due to friction
The next step is to determine the specific pressure loss due to friction based on tabular data or nomograms. In some cases, a calculator can be useful for determining indicators based on a formula that allows calculations with an error of 0.5 percent. To calculate the total value of the indicator characterizing the pressure loss over the entire section, you need to multiply its specific indicator by the length. The roughness correction factor should also be taken into account at this stage. It depends on the absolute roughness of a particular duct material, as well as the speed.
Calculation of the dynamic pressure indicator on a segment
Here an indicator characterizing the dynamic pressure in each section is determined based on the values:
- air flow speed in the system;
- air mass density under standard conditions, which is 1.2 kg/m3.
Determination of local resistance values in areas
They can be calculated based on local resistance coefficients. The obtained values are summarized in tabular form, which includes data from all sections, not only straight sections, but also several shaped parts. The name of each element is entered in the table, and the corresponding values and characteristics are indicated there, by which the local resistance coefficient is determined. These indicators can be found in the relevant reference materials on the selection of equipment for ventilation units.
If there are a large number of elements in the system or in the absence of certain coefficient values, a program is used that allows you to quickly carry out cumbersome operations and optimize the calculation as a whole. The total resistance value is determined as the sum of the coefficients of all elements of the segment.
Calculation of pressure losses at local resistances
Having calculated the final total value of the indicator, we move on to calculating pressure losses in the analyzed areas. After calculating all sections of the main line, the resulting numbers are summed up and the total resistance value of the ventilation system is determined.
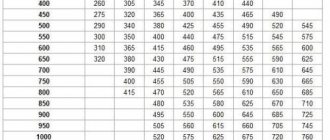
Table of maximum air speed depending on duct requirements
| Hood | Inflow | Hood | |||
| Living spaces | 3 | 5 | 4 | 3 | 3 |
| Hotels | 5 | 7.5 | 6.5 | 6 | 5 |
| Institutions | 6 | 8 | 6.5 | 6 | 5 |
| Restaurants | 7 | 9 | 7 | 7 | 6 |
| The shops | 8 | 9 | 7 | 7 | 6 |
Note: the air flow speed in the table is given in meters per second.